Digraphs are short for directed graphics - a method to represent data in terms of nodes (or vertices) and how they're connected, via edges. As usual, read the Wiki page for a detailed explanation, but here are some simple examples:
Example 1:
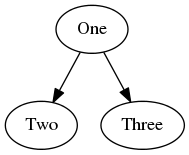
Example 2:
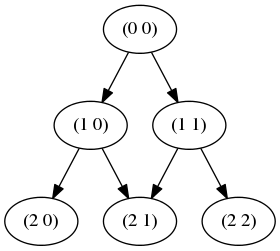
This page demonstrates a JavaScript/NodeJS library I wrote that lets you program a graph, generate a dot file, which can then be turned into an image, as shown above.
It's a typical NodeJS library, and so install with:
npm install jsdigraph
The build a simple example, such as:
 var di = new digraph();

 var n1 = di.addNode('One');
 var n2 = di.addNode('Two');
 var n3 = di.addNode('Three');

 di.addConnection(n1, n2);
 di.addConnection(n1, n3);

 di.setOption('rankdir', 'LR');

 console.log(di.generateDot());
Then type
node example.js >example_results.dotThe code outputs a dot file, which looks like this:
digraph G {
  "_1" [label="One" ];
  "_2" [label="Two" ];
  "_3" [label="Three" ];
  "_1" -> "_2";
  "_1" -> "_3";
}
That can be rendered into an image with:
dot -Tpng ex1.dot -o ex1.pngand appears as:

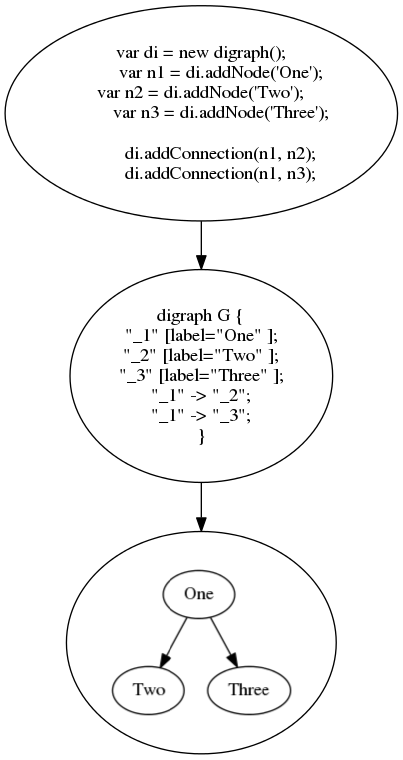
In fact, you can describe the process of creating digraphs in a digraph itself!
I had originally written the library (link below) to generate a map of all the levels in Jet Set Willy. Firstly, I created a version with text labels, and another with images. (Both too big for this page, so click to enlarge.)
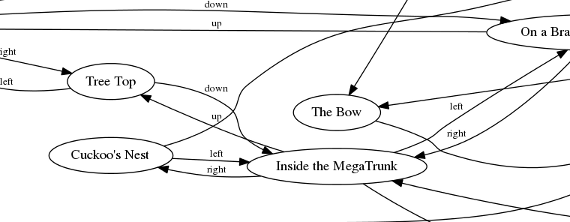
[Click to enlarge]
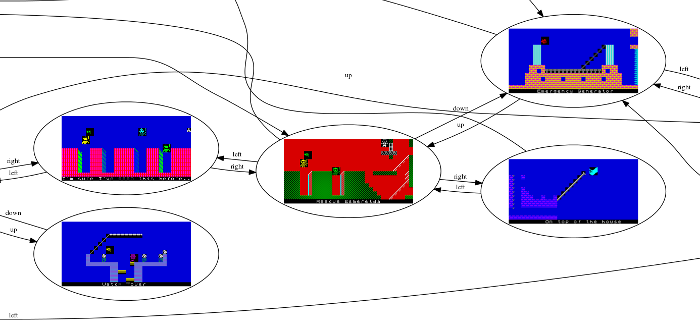
[Click to enlarge]
From here I did what any self-respecting geek would do - write a disassembler for the Z80 chip, retrieve the ROM image from a ZX81, create nodes for each Z80 instruction in the ROM, collapse the nodes that didn't get interupted by jumps, and build a digraph from that!
As you might have guessed, recursion lends itself very well to this type of graph.
function ex2() {
  var di = new digraph();

  addPascal(di, 0, 0, 3);

  console.log(di.generateDot());
}

function addPascal(di, a, b, max_depth) {
  var label = '(' + a + ' ' + b + ')';
  var us = di.findOrAddNode(label);

  if (--max_depth) {
    var left = addPascal(di, a+1, b, max_depth);
    var right = addPascal(di, a+1, b+1, max_depth);
    di.addConnection(us, left);
    di.addConnection(us, right);
  }

  return us;
}
Which outputs a dot file:
digraph G {
  "_1" [label="(0 0)" ];
  "_2" [label="(1 0)" ];
  "_3" [label="(2 0)" ];
  "_4" [label="(2 1)" ];
  "_5" [label="(1 1)" ];
  "_6" [label="(2 2)" ];
  "_2" -> "_3";
  "_2" -> "_4";
  "_5" -> "_4";
  "_5" -> "_6";
  "_1" -> "_2";
  "_1" -> "_5";
}
That renders as:
Obviously, recursion only gets you so far. Specifically, it gets you as far as your stack will allow! Therefore, we now support a non-recursion version where your function must 'request' each new item to be generated. Your function is then called to generate a new node, and return it to the library.
Here is the same Pascal's triangle example, using this mechanism. Since I don't want duplicate connections (or nodes containing the same data) I use checks to prevent this via findOrAddNode and isConnected.
function ex3() {
  var di = new digraph();
  di.traverse({a:1,b:1}, {max_depth:5}, cbhandler)
  .then(function() {
    console.log(di.generateDot());
  })
}

function cbhandler(ref, userdata, handler) {
  var label = '(' + ref.a + ' ' + ref.b + ')';
  var us = handler.findOrAddNode(label); // in this case there is a 1:1 mapping between the label and its contents

  if (userdata.max_depth) {
    handler.request({a:ref.a+1, b:ref.b}, {max_depth:userdata.max_depth-1})
    .then(function(node) {
      if (!handler.isConnected(us,node))
        handler.addConnection(us, node);
    });

    handler.request({a:ref.a+1, b:ref.b+1}, {max_depth:userdata.max_depth-1})
    .then(function(node) {
      if (!handler.isConnected(us,node))
       handler.addConnection(us, node);
    });
  }

  return us;
}
When I was a kid, I was a massive fan of these books, and would draw maps of the game to try and beat it. As an adult, I explored the opportunity to work on a modern updating of these game books. I wrote a lot of prototypal code, built some things, and had some assets created. Furthermore, I spent hours and hours typing in all the data from book. It looked something like this:
/* page 69 */ {
  actions: [
    {attime: 'end', process: "testskill"}
  ],
  options: [
    {text: "You manage to release yourself", page: 355, condition: "true", process: "null"},
    {text: "You fail to release yourself", page: 151, condition: "true", process: "null"}
  ],
  monsters: [
  ]
},
Unfortunately, the deal never happened. So, on a quiet Sunday morning, I decided to build a digraph of the entire game world. Click on the image below for a full (very large) version!
digraph NPM modules - The module written for this analysis
digraph NPM modules - The module, also on github
Generate images in the browser - A great way to test out your dot files
Jet Set Willy maps and digraphs - Generated with this library
Digraph in a digraph, in a digraph... - 8 levels deep!